U of I researchers develop interactive tool to track agricultural injuries, strengthen prevention efforts
Agriculture is one of the most dangerous occupations in the United States. Each year, vehicles, machinery, environmental hazards, and other incidents cause thousands of injuries and hundreds of fatalities. A thorough understanding of the main risks is key to preventing accidents and promoting agricultural safety.
A research team at the University of Illinois Urbana-Champaign has developed an interactive platform that allows users to obtain customized information about agricultural injuries. The researchers describe their work in a new article.
“The project started as a tool for Extension educators. We wanted to develop something they can use to learn more about the agriculture injuries in their own communities and to compare different regions. Eventually we decided to also include search options for researchers, who may have different data demands,” said co-author Salah Issa, Illinois Extension specialist and associate professor in the Department of Agricultural and Biological Engineering (ABE), part of the College of Agricultural, Consumer and Environmental Sciences and The Grainger College of Engineering at the U. of I.
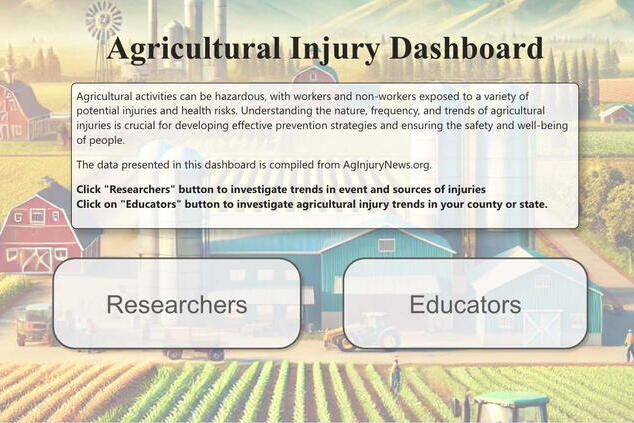
The Agricultural Injury Dashboard covers ag injuries in five Midwestern states. It contains tracks for researchers and educators to customize their queries according to specific purposes. The dashboard allows users to search on a variety of parameters and provides the information as interactive graphs and charts.
“Everything is interactive. If you click on any given year and a certain type of injury, every chart will highlight that specific injury type and provide the age, gender, and fatality distribution. These charts work in tandem, which allows you to hone in on the data according to your needs,” said lead author Sihan Li. She helped develop the dashboard as a doctoral student in ABE and now continues the work as a visiting Extension outreach associate.
The researchers first conducted a review of existing sources where users can look up ag injury information and found they weren’t very user-friendly. They set out to develop a tool that was functional, efficient, and easy to use.
To populate the dashboard, they used data from the AgInjuryNews database, which categorizes ag injuries from news reports across the U.S. and Canada. The researchers included AgInjuryNews data from Iowa, Illinois, Michigan, Minnesota, and Wisconsin, spanning from 2016 to 2024.
The dataset provides information such as cause and type of injury, location, time, and victim demographics. The data also includes codes for the Occupational Injury and Illness Classification System (OIICS) and the Farm and Agricultural Injury Classification (FAIC).
Li and Issa developed the interactive dashboard using Microsoft Power BI, which provides a range of visualization capabilities. They pilot tested it with different user groups, further refining the tools based on the feedback.
While the dashboard was developed in a partnership with AgInjuryNews, future updates will be populated by the researchers’ own data.
“The University of Illinois database for ag injuries is based on news clippings, and we also ask the Illinois Department of Public Health to review our information, so we can add any missing cases. It's probably one of the best datasets for fatal ag injuries in the state,” Issa said.
While this means the dashboard will be primarily focused on Illinois, Issa said it will be easy for users from other states to adapt it to their purposes by adding their own datasets.
Having access to a resource that provides an overview of agricultural injuries is essential to education and prevention, the researchers said.
“Accidents, especially fatal ones, happen rarely enough that you may not notice a pattern in your own community. Therefore, it’s important to stay abreast about what's going on in the wider region. If you see trends of incidents occurring across communities, you can launch various programs to educate farmers and address these issues before they grow bigger,” Issa said.
Eventually, the researchers hope to expand the dashboard to capture not just the occurrence of accidents, but also their monetary and human impact on communities.
The paper, “Design of an Interactive Agricultural Injury Dashboard: Enhancing Data Visualization and Stakeholder Engagement Using AgInjuryNews Data,” is published in the Journal of Agromedicine [DOI: 10.1080/1059924X.2026.2712970].
This project was partially supported by the Centers for Disease Control and Prevention–National Institute for Occupational Safety and Health with additional research support provided through the Hatch Act of 1887 from the U.S. Department of Agriculture’s National Institute of Food and Agriculture. This work also credits AgInjuryNews.org for providing access to agricultural injury data.